Sample and Experimental Details:
| Properties | Value |
|---|---|
| Molecular Weight | 25658 |
| Number of Amino Acids | 237 |
| Protein Concentration | 30.95mg/ml |
| Buffer Contents | Water |
| Sample Cell Pathlength | 0.00042cm |
| Sample Chamber Atmosphere | Nitrogen |
We are given four samples which are unknown to us right now, what we have to do is by using some deconvolution method and also using their experimental details we have to figure out the sample.
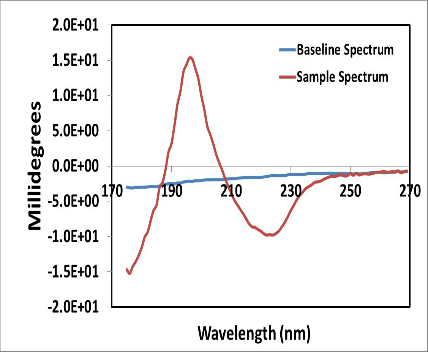
1) In this page, you can observe experimental details and variation of CD spectra with the wavelength for all the four samples.
2) Also you can observe how this samle spectrum differs from baseline spectrum which can be toggled using button present below the graph.
1) In this page, you can observe experimental details and variation of CD spectra with the wavelength for all the four samples.
2) Also you can observe how this samle spectrum differs from baseline spectrum which can be toggled using button present below the graph.