To study the Optical Rotatory Dispersion (ORD) of some chiral substances
In the previous experiment we have seen that optical rotation of a plane polarised light changes with the wave length of the light when it passes through an anisptropic medium. We measure this change in optical rotation per unit length of the medium as specific rotation. In ORD spectroscopy we change the wavelength of the incident light and measure the change in specific rotation of the light. So an ORD spectrum will give us a plot of specific rotation (some times molar specific rotation) against wavelength. Depending on the nature of the chiral center different anisotropic medium produces different ORD spectrum. Hence ORD spectra may be used as a very efficient tool to determine the nature of chirality in an anisotropic medium.
ORD spectra
Now let us see how different types of ORD spectra represents different physical properties of a medium.
Dispersion and Plain ORD Curve
These curves are observed for transparent compounds in the UV range.A plain curve results showing a steady increase (or decrease) of optical rotation with decrease in wavelength. These curves does not cross the zero-rotation axis and are devoid of maxima or minima within measurable range. So-called plain curve is the ORD for a chiral compound that lacks a chromophore. For Example, alcohols and hydrocarbons exhibit such kind of ORD curves.

Another Property, Absorbance : Anomalous ORD Curve
We have mentioned the term chromophore. It is the part of a molecule where absorbance of light takes place. This occurs because at this part energy of electronic transition between two molecular orbitals with energy of the photons of the incident light. Incident light that hits the chromophore can thus be absorbed by exciting an electron from its ground state into an excited state. So there is a range of wavelength,called the absorption band, where the light is absorbed. This absorption band has a maxima at a particular wavelength λmax. As a result there comes an anomaly in the ORD curve at the neighborhood of the chromophore. The absolute magnitude of the optical rotation at first varies rapidly with wavelength, crosses zero at absorption maxima and then again varies rapidly with wavelength but in opposite direction. Such anomaly is known as Cotton effect. As opposed to plain curves, these curves exhibit a number of extreme peaks and troughs depending on the number of absorbing groups. The Cotton effect is called positive if the optical rotation first increases as the wavelength decreases (as first observed by Cotton), and negative if the rotation first decreases. The following figure exhibits both types of Cotton effects.

Figure shows absorption band and -ve & +ve cotton effect near the absorption maxima
Octant Rule: an empirical method to determine type of Cotton effect in Ketones
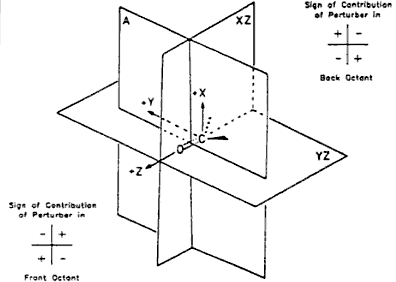
In case of saturated alkyl ketones there is a way, known as octant rule, to predict the sign of cotton effect (+ve or -ve) directly from the understanding of the structure. We can divide the space around the ketone into eight octants by looking down the carbonyl as shown below.

source: Circular Dichroism Principles and Applications Second Edition edited by Nina Berova,Koji Nakanishi,Robert W Woody Page 233
Four octants in the front of the oxygen (toward the observer) and four behind. The front four can be ignored but the rear four usually contain all the atoms in the molecule. Each of these four rear octants are assigned a sign(+ ve or -ve) and all the atoms of the molecule are distributed in these four octants. Now depending on the occupancy of these four octants the sign of the cotton effect may be determined. The sign of the octant having highest occupancy determines the sign of the cotton effect.
Goal of The Experiment
In this experiment user will observe CD and ORD spectrum of same samples. These samples are chiral molecules with chromophore. It is expected that by doing this experiment the user will develop an understanding of interrelations between ORD and CD spectra.
